Recap of Hacks/Hackers NYC Demo Day: Lots of Raphael
Suggest editsThe New York City group of Hacks/Hackers metWednesday, December 1 for Demo Day at the generously donated space, New Work City.

The pizza, from Lombardi’s, was delicious and the place was packed. (Sorry to those on the waitlist)

Here’s a quick review of each of the speakers and their demos:
- Kushal Dave, a FourSquare engineer, who presented an advance off-the-recordish look at the new FourSquare API.
- David Moore with OpenGovernment.org, a version of OpenCongress for states and cities that will be launched in public beta in December with five state legislatures.
- Dan Nguyen of ProPublica, who reviewed the data gathering and data structuring behind Docs for Dollars.
- Jeff Larson of ProPublica, uncovered self-dealing of Collateralized Debt Obligationss within the finance world via an easy-to-visualize network graph.
- Jeremy Singer-Vine with Text Toggle, developed with Slate, which gives publishers an easy way to create, embed, and present interactive translations.
- Shesha Pancholi of Newscred with a live demo of an experimental curation tool.
- Erik Hinton & Al Shaw with the TPM election night app, a high-class production made with limited resources.
- Daniel Bachhuber with the EditFlow WordPress plug-in, now in version 0.6 which will let you control the whole editing process — from pitch to publishing — within WordPress.
You get a special bonus fact from each presenter, their favorite song
First up was Kushal Dave of Foursquare.
Kushal demo’d the yet-to-be released Foursquare API, which had been his baby for the past few (or more-than-a-few) months. Basically, the new API has one key improvement: documentation. The older one will be deprecated sometime in 2011. Originally the demo was a bit hush-hush-not-quite-official, but Kushal allowed us to talk about it here. He gave some great previews and promised us all that the new API would be totally friendly.
Here are some current examples of sites using the API:
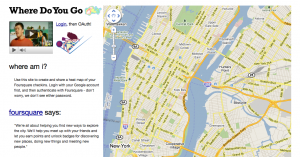
****Wheredoyougo.net, visualization of where you visit based on Foursquare check-ins.
Beerby.com, for the microbrewery fans, you can record what beers you drank where.

Momento, keeping track of things you need to do once you get into a neighborhood.

Some notes from Q&A with Kushal:
– You can’t add extra data onto check-ins, have to keep your own database for now.
– It’s tricky to get full list of places that are the most popular. The solution is to first start with a list of places, then go see if they’re popular
– Users can’t tag tips, yet.
FAVORITE SONG: Kushal’s been really enjoying Kanye West’s new album.
Next up is David “Gonna Liberate the Data No Matter What“ Moore of the Participatory Politics Foundation
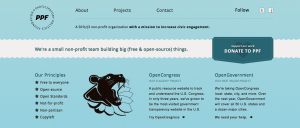
His demo was OpenGovernment.org, a state (and local) version of OpenCongress.org, that combines official legislation + blogs + news + campaign donation info into an elegant and easy to use website. Eventually it could extend to large institutions like the UN and the World Bank.
This is all very is all appreciated because a lot of institutional websites are unfortunate:
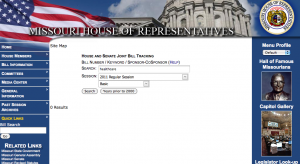
This brings us to OpenGovernment.org.
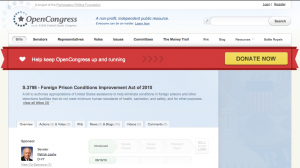
It’s just getting ready to launch with data from in five state legislatures — California, Louisiana, Texas, Maryland, and Wisconsin — which were selected in part because their data was easy to gather. On OpenCongress, the bills and legislation are what get the most traffic. The design encourages entry points through issues, and each bill connects constituents directly to their representatives. Users can also sort bills by most viewed, key votes, and there are RSS feeds. The API is open, it’s all open source.
More, directly from David:
- We’re looking for volunteer programmers to help build our open-source Ruby on Rails web code :: https://github.com/opengovernment/opengovernment
- Join the community-driven project to scrape legislative data from state gov’t websites :: http://openstates.sunlightlabs.com/
- We aim to launch OpenGovernment as a public beta in December 2010 with information for five state legislatures: CA, LA, TX, MD, and WI. With additional resources, we seek to roll out OpenGovernment to the remaining 45 U.S. states over 2011 and beyond. Then:: state legislatures, city councils, neighborhood associations, international institutions, the other branches of the federal government (Executive and Judicial), public-mission institutions such as schools & hospitals, foreign countries with more-or-less democratic systems, and more.
- Our volunteer page, crowdsourcing the liberation & standardization of contact info for members of state gov’t ::
- https://www.drumbeat.org/project/opengovernment-needs-open-data
This is David’s Favorite song. It’s “United Feeling” by Restless People.
Recommended Links:
- Projectvotesmart.com has an underused API that opengovernment.org uses. And loves.
- Drumbeat project
- Littlesis.org “rad rad project for accountability”
- Sunlight Foundation
- Opensecrets
- Followthemoney
- For those of you playing along —> At the City level – there is no way to follow the money
Next up: Jeremy “Wrote First Line of Code Two Years Ago” Singer-Vine presenting Text Toggle
Text Toggle (a.k.a. “Plain English”) creates a simple and elegant interface is a tool that lets users flip back and forth between two versions of a text, any chunk of text at a time—word-by-word, sentence-by-sentence, paragraph-by-paragraph. In collaboration, Slate and NPR’s Planet Money have used the tool to “translate” the Federal Reserve’s public statements from econo-speak to more direct language. They’re looking for new ways to use this technology, so email him at slatelabs[at]gmail[dot]com.
The Text-Toggle widget consists of just three files — a .json file that stores the two versions of text, a .js file that writes the widget to the page and controls the toggling, and a .css file to add styling. Text-Toggle was designed to be easily embeddable, as it requires just two lines of HTML to display. And the team is working on a publicly-available tool that would allow educators, bloggers, and other publishers to easily create and embed their own Text-Toggle widgets. They want to open source the entire project, but they are looking for advice as to which license to use. as Slate’s never released code before – ever. So email Jeremy with tips.
Jeremy’s favorite song right now? “Diamonds on the Soles of Her Shoes” by Paul Simon
Shesha Pancholi with the editorial curation tool**, Newscred.**
This is a realtime inline editorial curation tool, with aggregated news and full-text premium content.

They were originally based in Europe, out of Switzerland, but now they’re in New York City. Originaly, their main product was topic pages, but they went on to dive deeper into helping news sites manage content, keep it relevant and timely. The advantage is that it gives editing teams full control.
A screenshot of the live demo:
Shesha’s favorite song right now is the Eddie Vedder and Nusrat Fateh Ali Khan’s song The Long Road.
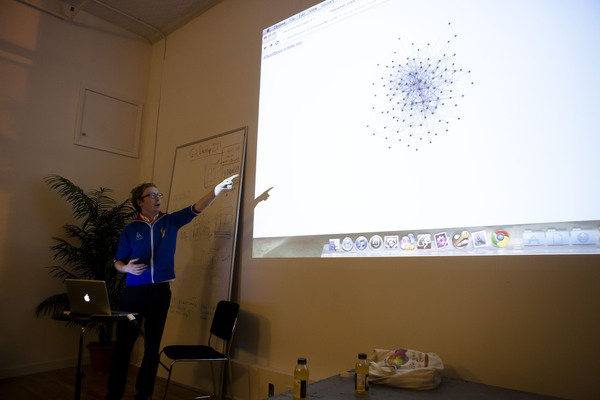
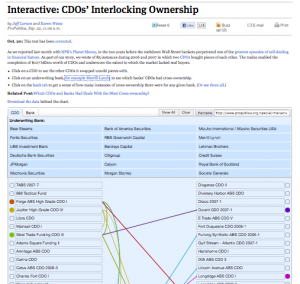
Jeff Larson of ProPublica presents a way to visualise complex relationships relating to self-dealing of CDOs within the finance world.
In case you were wondering just how crazy things got before the financial collapse, Jeff can show you. But first you might want to listen to the NPR’s – This American Life episode, where you’ll really get the lowdown.
Jeff did a longer post on how he did the presentation on the Pro Publica blog. But they wanted to show the interconnected relationships of the CDOs, which usually looks more of a jumble when displayed as the classic network graph problem. Instead, they showed it in side-by-side layout, because unlike classic network graphs, the actual nodes were as important as the connections. For example it’s very important that Merrill Lynch did so many of these deals. Also, they thought it was very important that people could share specific views of the data so we made it permalinkable (something may data visualizations lack).
Behind the scenes the whole thing is made with JavaScript and a SVG abstraction layer called Raphael, which makes drawing fast and easy on HTML web pages. The data itself came from a company called Thetica systems.
Merrill Lynch sold portions of its CDOs to itself over and over and over again – it’s “the inside story of one company, one small group of people, who made hundreds of millions of dollars for themselves while worsening the financial crisis for the rest of us.”
After the world ended in 2009, the CDO market petered off. And because of this graph you can see why. The data came from a private company, and it also
Dan “When you take that little extra step yourself, it makes it that much more valuable” Ngyuen, also of ProPublica.org presenting Dollars for Docs
The crux of this data’s online exposure project is this: doctors get paid by pharmaceutical companies – to speak, to consult — and this project lets you see that data. Over 30,000 payment records (that had been public – but in a cabinet ) weren’t even in a format that was more accessible than a PDF – until now. Also noteworthy, the project was mentioned in a review about “Love and Other Drugs” – the Jake Gyllenhall movie – as “the subject of a major Pro Publica News expose just this fall.__”

The highest paid doctors are either very good or totally questionable. After the release, they’ve had investigators, academics contact us for their data, which had technically been available before. It’s evidence that when you take that little extra step to prepare data yourself, and make it accessible, it makes it that much more valuable to many people.
They looked into doctors who were the top earners among the pharma companies and found that some of them had few obvious credentials as experts, or even worse, had disciplinary actions taken against them by their state boards. As a followup to the first story, [we released a list of nearly 300 doctors who were being paid as promotional speakers][37] but had problematic disciplinary records. Drug companies promised to change their screening processes.
Dan was writing a guide on how to webscrape data (so he wrote a script to get Pfizer website data) – and then Eli Lilly released their data, but made it impossible to download – it was a crappy flash thing.
“I saw that as just a, y’know, challenge.“
So Dan set out to parse a Eil Lilly’s flash document. So, even though Eli Lilly released it in PDF eventually, the code’s still there.
[Dan will be writing about this whole process soon.][38]
More from Dan:
I didn’t have time to give credit to the rest of the people who worked on this. The two lead reporters were Charles Ornstein and Tracy Weber, Charlie was the one who approached me after I wrote a tutorial on scraping Pfizer on my blog, and had wanted to do such a thing for every drug company. They both have won Pulitzers in health coverage before. Nick Kusnetz, one of our researchers, did the long task of confirming doctor identities from the messy company records. Jeff Larson, who also spoke, put together an embeddable widget that allowed people to search paid doctors. And also, after just a few hours of sleep the morning after launch, he whipped up a solution to deploy and update our site even as it was being hammered with traffic: http://propublica.github.com/thinner/
His favorite song right now is [the Patsy Cline classic, Crazy][39]
Recommended links:
- [Google Refine][40] – a great bulk data cleaning tool
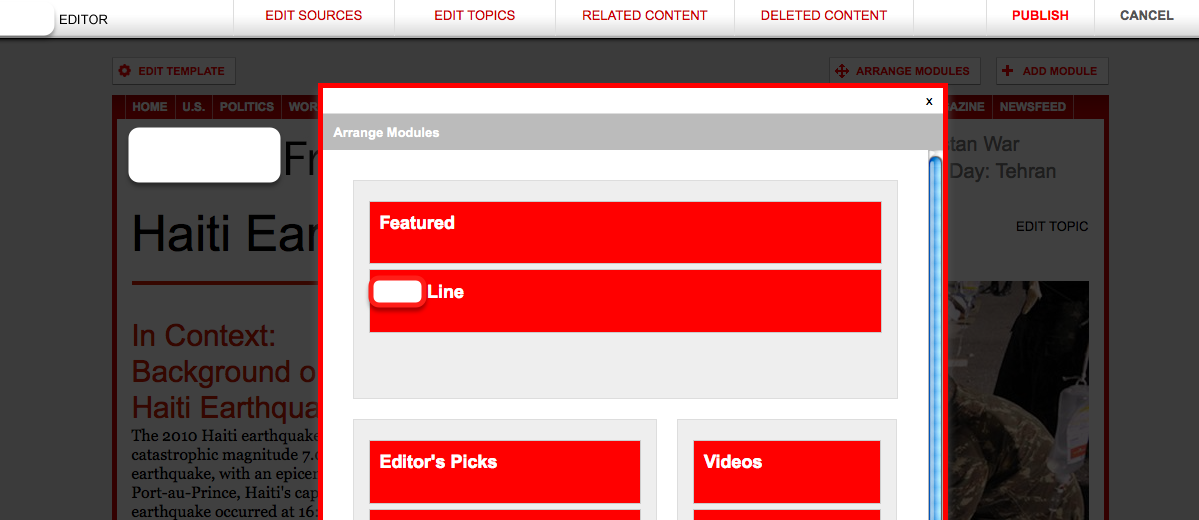
[Editflow][41] with Daniel “Structures = Mo’ Win” Bachhuber
**
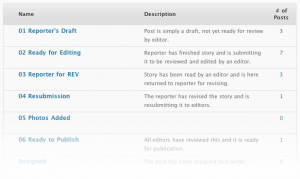
This is a [WordPress plugin that lets you control the whole editing process,][41] so your team isn’t bouncing around from emails, word processing programs, Word, Google Spreadsheets and many other random places. This is a problem for news organizations. Editflow solves this problem by providing one place to go to regulate your team’s editorial workflow. Daniel’s favorite song, though he’s reluctant to admit it, is this:
http://www.thehoodinternet.com/2010/11/dirty-diamonds-vs-two-door-cinema-club.html
[Direct link to Editflow slides][42]
Editflow has:
- individualized workflow
- editorial comments
- calendar review
- story budget view
- the ability to group stories by category – when last updated, description
- custom editorial metadata
- ability to associate metadata with posts
- email notifications
[
][43]
Last and not least is TPM’s [Election night site][44] presentation with [Al Shaw][45] and [Eric Hinton][46]
This site, which [you can still visit][44], received 2 million pageviews. At its peak on election night, 5,000 people were on the site simultaneously.

The unfortunate thing initially with the project was that the AP data they wanted is stored in a giant zip file on an ftp server (dramatization below)

So they had to hack a bit. They parsed out file names to create their own IDs every 3 minutes. The project was done with Ruby, [Sinatra][47] and Raphael Javascript library.
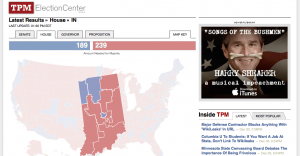
Illinois. Lookin good.
Trust, the presentations were even better than the pizza. (and the pizza was on POINT). Hacks/Hackers looks forward to seeing this projects as they progress (and we hope you do, too!). Check into your favorite project and get involved!
[37]: http://www.propublica.org/article/pharma-payments-to-doctors-with-sanctions Dan w [38]: http://twitter.com/dancow [39]: http://www.youtube.com/watch?v=Zzq5X-p2C0Y [40]: http://code.google.com/p/google-refine/ [41]: http://www.editflow.org/ [42]: http://db.ly/hhnycef [43]: http://Db.ly/hhnycef [44]: http://election2010.talkingpointsmemo.com [45]: http://twitter.com/a_l [46]: http://twitter.com/erichinton [47]: http://www.sinatrarb.com/