How we made our maps | Hacks/Hackers NYC
Suggest editsWhen a story is best told through a visual representation of geography, maps are often the best way of telling it. Three journalists joined Hacks/Hackers NYC to explain how they approached mapmaking for their recent projects. Slides and code from their presentations are available in this link bundle.
While New York was preparing for Hurricane Irene, John Keefe, WNYC’s senior executive producer for news, decided to create a hurricane evacuation map so people could see whether or not they needed to leave their homes.
He used Google Fusion Tables to make what became one of WNYC’s most viral news application. The process was simple and fast, he said. John uploaded shapefiles of the evacuation zone found in the NYC Datamine to Google FusionTables using Shape to Fusion. He then customized his map with FusionTablesLayer Builder and added JavaScript to create a search box so users could see if they needed to evacuate. The final map:
Learn more about John’s process on his blog.
Albert Sun from The Wall Street Journal gave insight to how he made his Census Map Maker. Inspired by sites like the Redistricting Game and the Public Mapping Project, Albert set out to make his own map which would allow users to draw their own maps and find census information for the areas they marked. He used a JavaScript overlay on Google Maps and coded the map with GeoDjango.
Albert has open-sourced his code and posted it to Github.
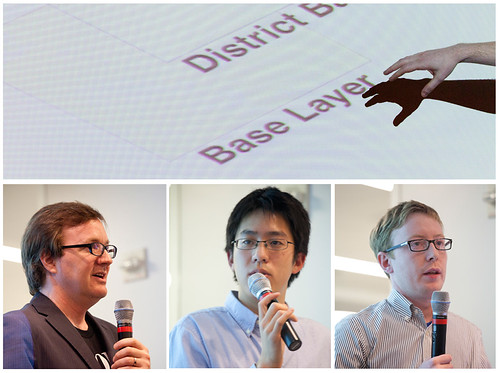
ProPublica’s Jeff Larson spoke about two interactive maps he the produced for ProPublica’s investigation into corporate influence in the redistricting process. In his maps, Larson combined census data with district maps to show how voter districts were segregated in ways that would favor certain candidates or keep ethnic groups together in a voting bloc. (Watch a video about the complicated issue.)
Each map is dynamically generated from over 2GB of data through a new mapping library ProPublica wrote in-house with C, API and Ruby.
Watch all three presentations in the video below:
View the story “Hacks/Hackers: How We Made Our Maps” on Storify]